If you’ve felt like stock prices have been more volatile in 2022 than in recent years, you’re right on the money. Let’s take a look.
Big picture
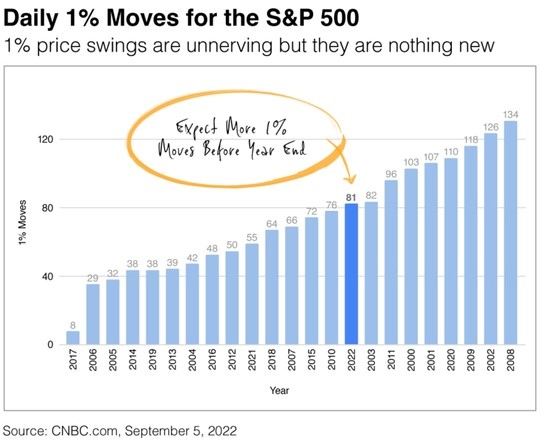
The S&P 500 has posted 81 daily moves of at least 1% through August. Of those moves, 39 have been to the upside and 42 to the downside.
In this chart, we’ve highlighted 2022 to show how it compares to other years since 2000. Since the daily report was compiled, stocks have seen a few more 1% swings.
Why’s this happening?
The Fed, largely. Its monetary policy of raising interest rates to slow inflation without triggering a recession has created a lot of uncertainty.
- With more than 70 trading days left in the year, it’s probably a safe bet to say we could see more.
- Price swings are unnerving, but as that chart above shows, they are nothing new.
Digging deeper
We’re entering a tricky time of year: the Fall has a reputation for bringing an extra measure of market volatility.
- Some of the stock market’s most challenging events have hit in September and October.
- Other seasonal trends can also play a part. Investopedia found that institutions start preparing for year-end distributions around this time.
- Plus, individuals tend to reposition their portfolios after the summer months.
This chart shows the average weekly S&P 500 performance since 1923. We’ve highlighted September and October so you can see how they compare to the rest of the year.