ABSTRACT
Islamic investment process begins by filtering companies for compliance with Shari’ah and other ethical criteria. Azzad’s proprietary software tool (the Investment Screening/Filtering Application, or ISFA) has the capacity to screen thousands of public companies domestically and abroad to ensure that investment selections are consistent with guidelines established by the Accounting and Auditing Organization for Islamic Financial Institutions, the industry’s preferred standard-setting body. Using this process, Azzad analysts define the universe from which the firm’s multiple investment managers may select securities. Many Shari’ah-sensitive investors wonder how the Islamic screening process might affect the performance of their portfolios. As this paper outlines, the answer lies, in part, with the sector allocations of traditional portfolios and their Islamically screened counterparts.
UNDERSTANDING INDICES
Simply put, an index is a hypothetical portfolio of securities representing a particular market or a portion of it. Indices (plural of index) are often composed of sectors and industries that represent companies with similar lines of business. Although no thorough studies have been done to compare the sector allocations and performance of conventional and Islamic portfolios, one way to begin exploring the impact of Islamic screens is by comparing a conventional index to its Islamic equivalent, making sure both have the same investment objective.
For the purposes of this analysis, we will use indices, instead of actively managed portfolios, because deviations in sector allocations and over or underperformance can be attributed to the stock selection of the portfolio manager with the latter. An index’s sector allocation and performance, however, is determined primarily by the investment criteria it follows.
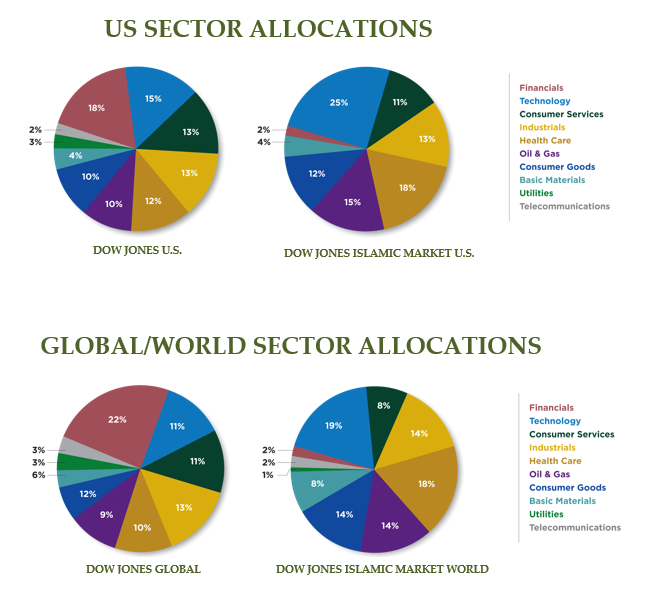
We will take a look at the Dow Jones U.S. Total Return Index versus the Dow Jones Islamic Market U.S. Total Return Index, in addition to the Dow Jones Global Total Return Index versus the Dow Jones Islamic Market World Total Return Index. This will allow us to see the sector allocations and performance differences both domestically and globally. The sector allocations of these indices as of June 30, 2014 are listed on the following page.
OBSERVATIONS
The most glaring difference between these domestic and global charts is the almost complete lack of financials services in the Islamic indices relative to the traditional indices. This is to be expected, of course, due to the Islamic prohibition against interest, or riba in Arabic.
This is also a significant observation as financials are the top asset class in both the traditional indices, with an 18% and 22% allocation on the U.S. and Global levels, respectively. Due to the lack of financial services in the Islamic indices, other industries are more heavily represented.
The sectors which stand out the most in the Shariah-screened indices are technology, healthcare, and oil & gas. When comparing the domestic conventional and Islamic indices, technology, healthcare, and oil & gas are more heavily weighted in the Islamic index by a margin of 10, 6, and 5 full percentage points. With respect to global indices, those same sectors in the Islamic index are overweight by 8, 8, and 5 percentage points, respectively.
Based on these initial observations, one would expect the Islamic indices to be negatively correlated with the performance of financial services. The Islamic indices should outperform traditional indices when financial services underperform relative to other sectors, and vice versa. Additionally, it also stands to reason that the performance of Islamic indices should be positively correlated with the technology, healthcare, and oil & gas sectors.
The Islamic indices should outperform traditional indices when those industries outperform financial services, and vice versa.

INDEX AND SECTOR PERFORMANCE
To test our assumptions, let us look at index and sector performance over the last two decades:
Index/Sector Performance (US)
| Pre-Dot-Com Bubble Burst: Jan 1996 – Feb 2000 | Post-Dot-Com Bubble Burst: Mar 2000 – Oct 2002 | Great Recession: Dec 2007 – Jun 2009 | 2012: Jan 2012 – Dec 2012 | 10 Yrs: Jul 2004 – Jun 2014 | Since Earliest Common Date: Jan 1996 – Dec 2016 | |
| DJ U.S. Total Return | 23.19% | -15.30% | -23.61% | 16.29% | 8.35% | 8.48% |
| DJ Islamic Market U.S. Total Return | 33.48% | -22.61% | -18.83% | 12.66% | 8.64% | 8.71% |
| DJ U.S. Fin Total Return | 16.65% | 7.25% | -39.61% | 26.84% | 1.61% | 7.60% |
| DJ U.S. Tech Total Return | 53.72% | -41.39% | -17.86% | 12.08% | 8.43% | 9.18% |
| DJ U.S. Health Care Total Return | 21.17% | -2.51% | -15.34% | 19.28% | 10.07% | 10.31% |
| DJ U.S. Oil & Gas Total Return | 14.28% | -1.76% | -20.52% | 4.71% | 13.78% | 9.78% |
Index/Sector Performance (World)
| Pre-Dot-Com Bubble Burst: Jan 1996 – Feb 2000 | Post-Dot-Com Bubble Burst: Mar 2000 – Oct 2002 | Great Recession: Dec 2007 – Jun 2009 | 2012: Jan 2012 – Dec 2012 | 10 Yrs: Jul 2004 – Jun 2014 | Since Earliest Common Date: Jan 1996 – Jun 2014 | |
| DJ Global Total Return | 17.04% | -16.85% | -24.98% | 16.54% | 7.93% | 6.09% |
| DJ Islamic Market World Total Return | 30.73% | -23.11% | -20.92% | 13.14% | 8.28% | 7.60% |
| DJ Global Fin Total Return | 7.84% | -2.78% | -35.34% | 28.27% | 3.68% | 5.40% |
| DJ Global Tech Total Return | 49.09% | -41.51% | -20.06% | 13.98% | 7.48% | 7.68% |
| DJ Global Health Care Total Return | 18.34% | -3.38% | -15.79% | 18.09% | 9.92% | 10.10% |
| DJ Global Oil & Gas Total Return | 11.87% | -.28% | -20.12% | 3.12% | 11.09% | 10.89% |
FIRST IMPRESSIONS
As expected, the Islamic indices significantly outperformed conventional indices in the time period before the Dot-Com Bubble burst, when technology and healthcare significantly outperformed financials. The opposite was true after the bubble. During the Great Recession, when financial services were the hardest-hit sector, the Islamic indices once again outperformed. However, for the 2012 calendar year, financial services significantly outperformed all three of the other industries, leading to underperformance of the Islamic indices.
THE TAKEAWAY
Perhaps the most interesting observation is that when comparing the long-term performance of the indices (Both the 10-year and since earliest common date periods), the Islamic indices outperform. Why? One can reasonably conclude this behavior is due mostly to the long-term lagging performance of Islamically prohibited industries, specifically financial services, combined with the long-term outperformance of permissible and overweight industries like technology, heath care, and oil & gas. This is evident from the long-term performance results of these sectors.
However, only time will tell if this trend will continue. As the investment advisory industry disclaimer goes: Past performance is not indicative of future results.
Note: Performance charts are copyright © 2014 by S&P Dow Jones Indices LLC, a subsidiary of The McGraw-Hill Companies, Inc., and/or its affiliates. All rights reserved. Standard & Poor’s, and S&P are registered trademarks of Standard & Poor’s Financial Services LLC (“S&P”), a subsidiary of The McGraw-Hill Companies, Inc. Dow Jones is a registered trademark of Dow Jones Trademark Holdings LLC (“Dow Jones”).
The Dow Jones U.S. Total Stock Market Index measures all U.S. equity securities with readily available prices. The Dow Jones Global Total Stock Market Index measures more than 12,000 equity securities from 77 countries. The Dow Jones Islamic Market US Total Return Index tracks equity securities traded in the U.S. that pass rules-based screens for compliance with Islamic investment guidelines. The Dow Jones Islamic Market World Total Return Index tracks equity securities traded in 70 countries that pass rules-based screens for compliance with Islamic investment guidelines.
Information contained in this publication is not intended to replace specific advice or recommendations by your investment adviser. It is not intended to provide tax, legal, insurance or investment advice, and nothing in this publication should be construed as an offer to sell, a solicitation of an offer to buy, or a recommendation for any security. Unless otherwise specified, you alone are solely responsible for determining whether any investment, security or strategy, or any other product or service, is appropriate or suitable for you based on your investment objectives and personal and financial situation. You should consult an attorney or tax professional regarding your specific legal or tax situation. Please check with your adviser for more information: 888.86.AZZAD, www.azzad.net.


